SCADA V10 - Process control solution for the energy and water industry
Innovative, safe and open
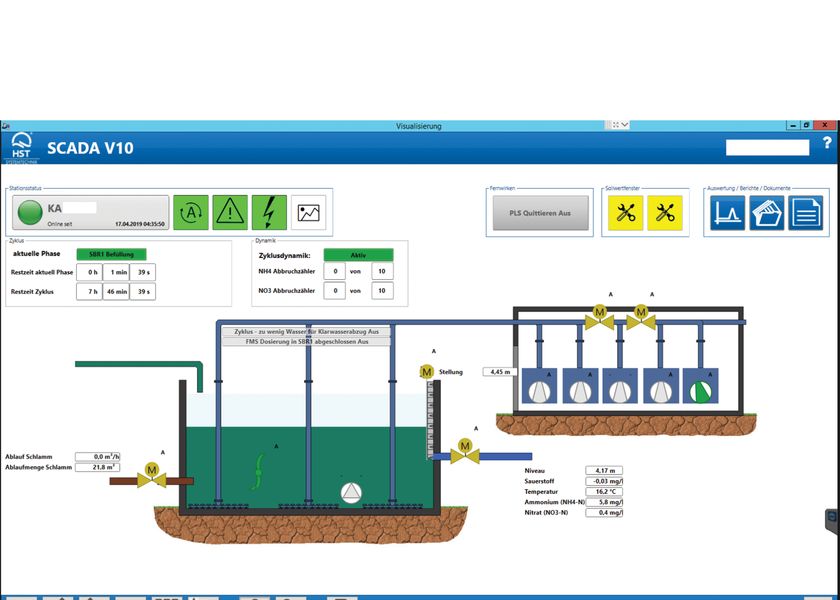
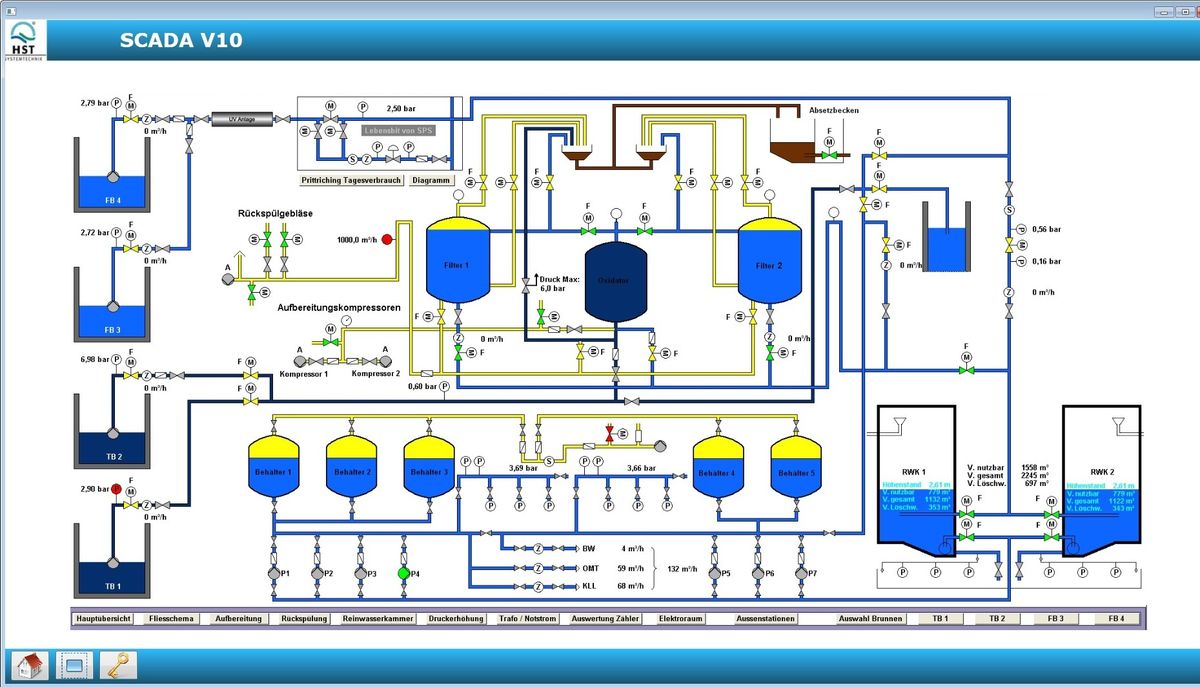
The user-friendly SCADA system supervises and documents processes performed by central and decentralized plants and devices. The SCADA V10 is highly integrated and visualizes all process data in a multi-touch HMI, which includes graphic analysis functions and reports. Complete alarm-management is one part of SCADA V10. The government rules and regulations of the German DWA form the basis of the report-systems, e.g. M207, M253 and M260. The SCADA V10 is fully featured, innovative and open.
Focus on the essential
Supporting a 'focus on the essential' is on of the major challeng of modern IT solutions. SCADA V10 is able to handle complex relations and the system functions in an easy and intuitive way. SCADA V10 makes it simple.
The design of the SCADA V10 user interface brings important functions to the interface and places less important functions in the background. The users do not need to handle a large number of icons and keep interconnected menus.
The user controls are placed in the right positions, just there where you expect them, and this is system-wide.
SCADA V10 is from a single source and is not made up of different products from different ventures. The HMI, reporting-system and alarm management use the same user interface as well as one single database.
Analyzing and reporting
If you have expertise about your processes, you will be able to optimize in order to achieve greater efficiency. This statement applies to operators and producers of the SCADA system. HST is unique in its position: As a supplier of over 7,000 components of plants, HST has excellent expertise which is transferred to our software designers.
Historical data by Delta-Event-Plus
The basis of any analysis is the quality of the data that has been recovered. For this reason, SCADA V10 archives after the HST Delta-Event-Plus process, thus ensuring an optimum database.
The Delta-Event process was established by HST over 20 years ago and has been continuously refined ever since. This flexible recording method ensures that any relevant change is detected and at the same time prevents unnecessary data from being archived. The cyclic archiving of discount amounts in dry weather is not a good idea. On the other hand, the recording of incidents with high accuracy is imperative. Therefore, a recording method must respond to the dynamics of the process and not just record averages over static time period.
All of the recorded data is archived in a professional database system. This ensures high and, in particular, the efficient availability of data.
The analysis of hydrographs
The representation of processes in the form of hydrographs is ideally suitable for the analysis. Often, a glance at a hydrograph is enough to make the first assessment. But often it is also necessary to combine different process data in order to assess this in relationship to one another. For this reason, SCADA V10 offers a highly functional graphical analysis.
Particularly in the case of an analysis tool with a wide range of functions, it is especially important that the user interface is ergonomically designed. Important and frequently used functions are quickly and easily accessible. Graphical analysis offers no boundaries.
All time ranges can be set freely and any number of hydrograph curves can be arbitrarily inserted in any number of chart windows. With a click of a mouse, the sum scanner calculates out the operating times of units or flow rates in the displayed time period. Comprehensive, easy and efficient - graphical analysis in SCADA V10.
Your advantages:
- Freely customized time ranges
- Any number of hydrograph curves and charts
- Sum scanner for units and calculation of quantity
- Different time ranges in a chart
- Representation in curves, bars, points
- Extensive library of functions
- Direct switching between the tabular and graphic view
- User-related management templates
- Ease of use